We’ve already established that post processing delivers a lot of value just from the perspective of really understanding what your code is doing, so it makes sense that the better the post processing tool, the better that understanding will be. Enter KCacheGrind, considered by some to be the best execution understanding tool out there.
GraphViz is a great set of tools, but if you read the previous article you might have got left with the feeling that we were leaving a lot of really useful information on the cutting room floor. The instrumentation we added to the code delivered not only what was calling what, but it also provided timestamp information (measured in processor clock cycles) indicating how long each routine was taking…and we threw that away. Turning that raw data into useful information isn’t trivial because you’ve got to deal with things like interrupts and call trees, but once you’ve got it there’s a whole treasure trove of information to explore. Lets grab some data and format it into a file suitable as an input for KCacheGrind (or it’s windows equivalent QCacheGrind)…back to our old friend orbstat;
>ofiles/orbstat -e firmware.elf -z test.out
The configuration of the target is exactly the same as for the last post, since it’s using the same data as input…just a different format for output…don’t forget to set the output channel, orbstat defaults to 30. After you’ve got some data, poke it into KCacheGrind;
>kcachegrind test.out…and you’ll be rewarded with something that looks a bit like this;
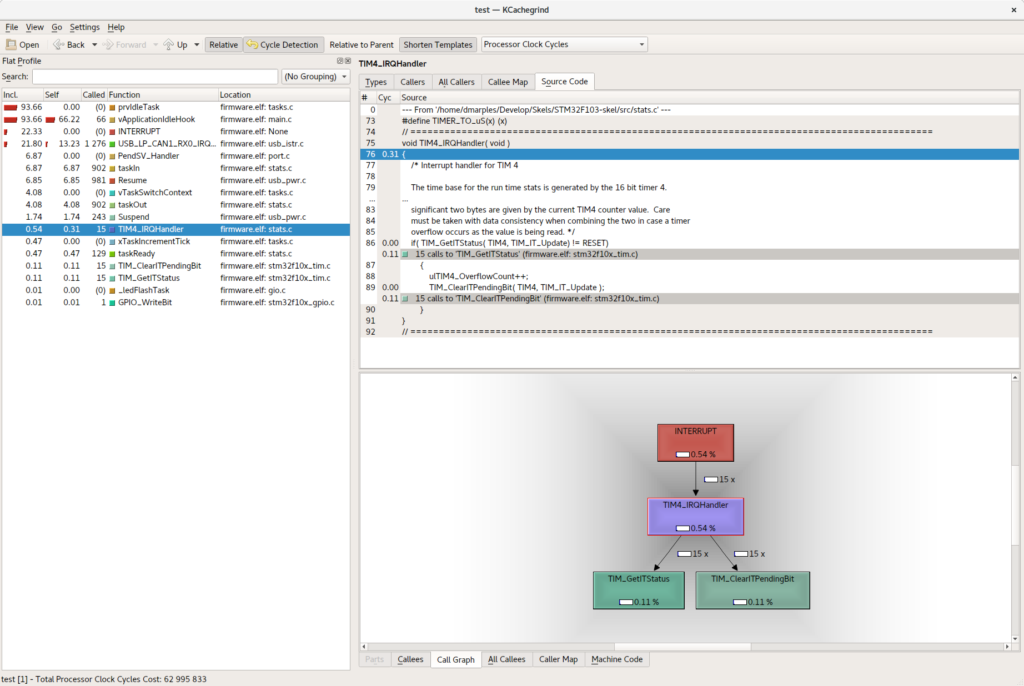
So, this all needs a bit of explaining, and I’m no cachegrind expert so you might find Google to be your friend, but let’s give it a go. To the left is the set of routines that were recognized during the sampling internal, together with the total amount of time spent in each of them both cumulatively (first column) and specifically in that routine (second). The number of calls is the third column and the rest should be pretty obvious….you can click around in those to centre on any routine.
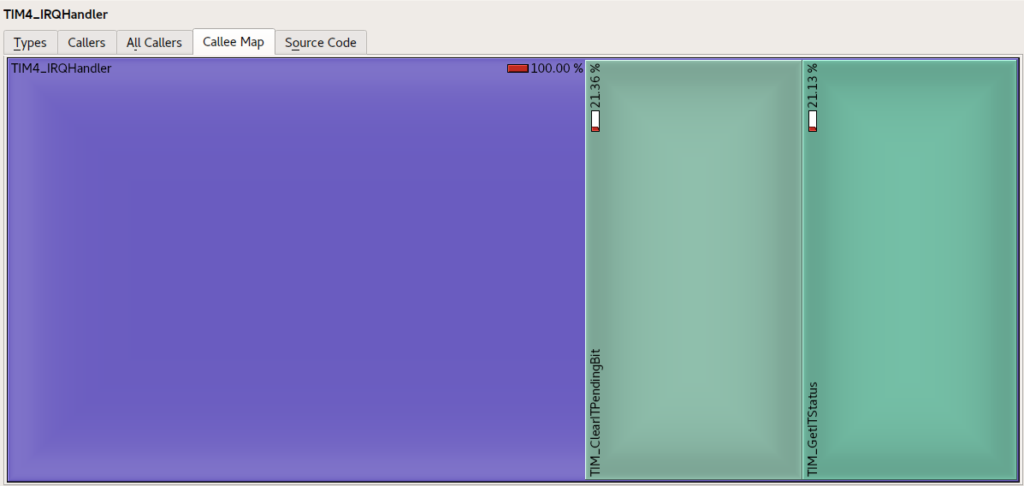
Top right are the various analyses of the code, including source code views, number of cycles taken in the code and the split of execution time between this routine and the routines its called. You can change the way the metrics are presented to be relative to the whole execution time, or to the parent, and you can express them as percentages and absolute processor cycles…..the ‘Callee Map’, for example, allows you to see how the overall execution time divvies up between the called routine and it’s inferiors, like this;
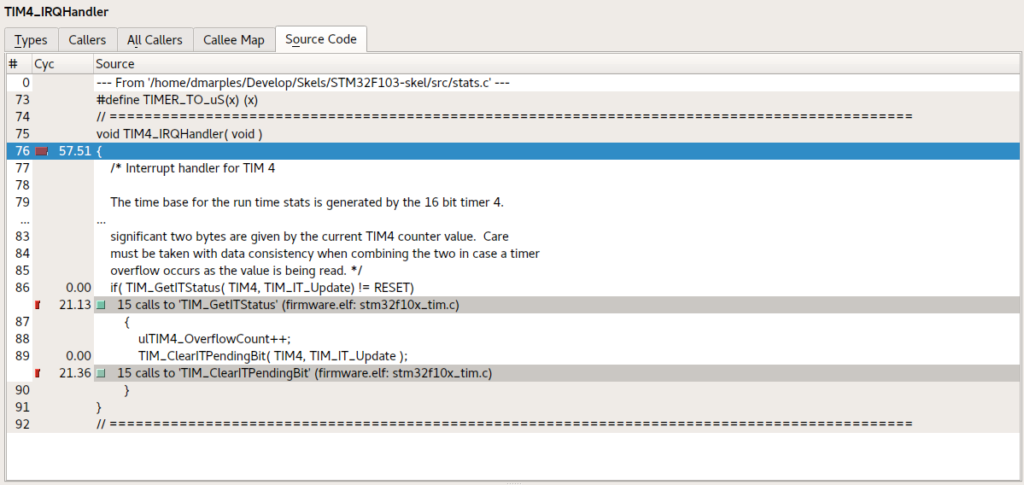
…and you can see what was going on in the source code too;
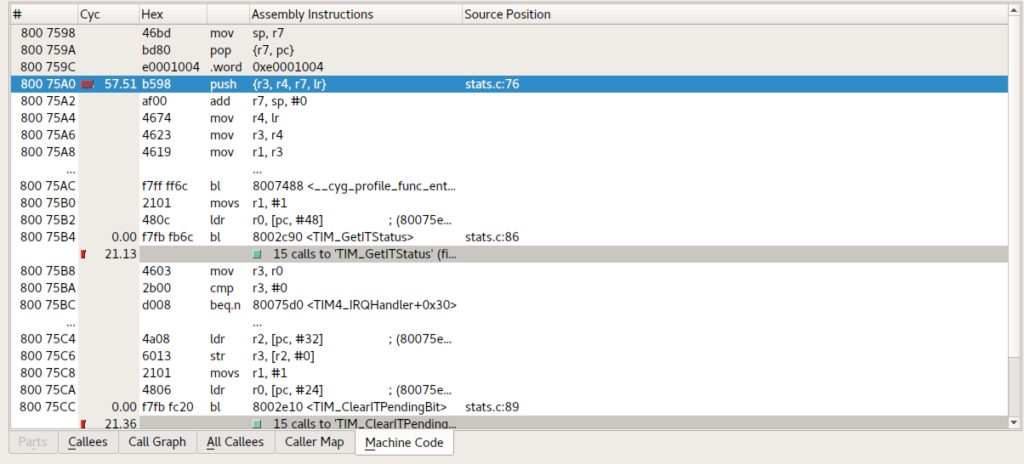
To the lower right you’ll also find the disassembly of the matching source code, for when you really want to get down and dirty with what is going on;
There’s one small gotchya with the dissassembly view; it uses objdump and chances are your system-wide objdump might not understand the binaries you’re compiling for your target. You will also find that KCacheGrind can crash because the format of objdump doesn’t match what it expects (specifically, the text Address XXXX is out of bounds can appear at the end of a disassembly, which upsets it terribly). No big deal, just create a new file called something like objdumpkc and put the following contents in it;
#!/bin/sh
~/bin/armgcc/bin/arm-none-eabi-objdump $@ | sed '/is out of bounds./d'
…then mark the file as executable and point the OBJDUMP environment variable to it before calling KCacheGrind, like this;
OBJDUMP=objdumpkc kcachegrind ....
Problem solved. Actually, the problem seems to be solved with versions of KCacheGrind downloaded and compiled directly from the source, but your distribution might well bundle an older version that still suffers this issue.
Most interesting, especially on complex projects, are the graphical views you can get of the relationship between routines and the execution splits between them. Those use graphviz just like in the previous article, but there are a lot more steroids in play.
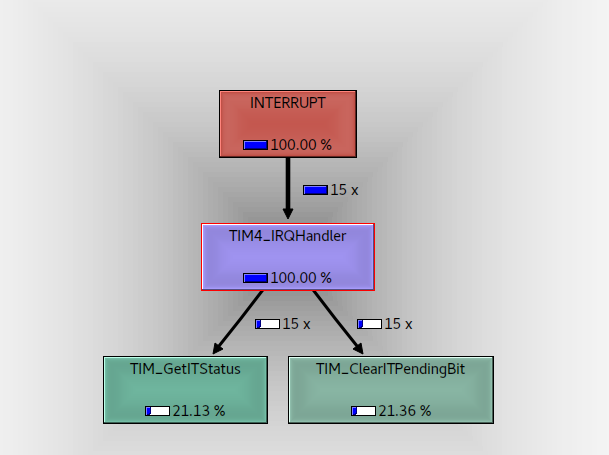
Those are shown in the bottom right panel (you can re-arrange all this lot by the way if you don’t like the layout) and, again, can be done in absolute, relative or cycles formats…Here’s where my timer handler is spending its time in response to the timer interrupt;
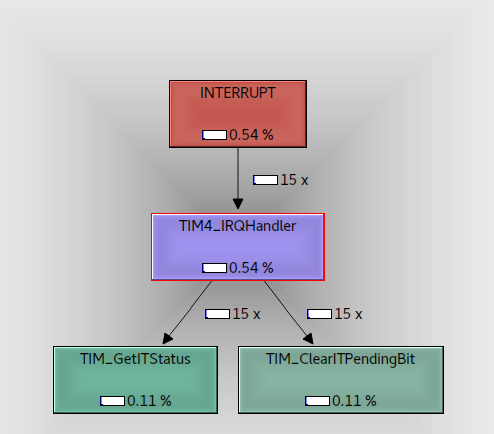
…and here’s the same information as a percentage of the total time the CPU spent doing stuff;
As you can see cachegrind is a much richer, more interactive way of understanding your system. It still has its limits (its a static snapshot after all, although CTRL-R will reload the file) but when you’re trying to figure out exactly where your CPU has gone, and which bits of your system need to be re-engineered, its a wonderful too.
The one remaining problem is when to grab the samples, ‘cos at the moment it’s just when you happen to stop the acquisition. Getting more sophisticated (tell me what my system is doing in response to event X, for example) needs us to start looking at triggers. That one is coming up.