Instrumenting your application, passing the resulting data over the SWO link and post processing it on the host side turns a lot of textual data from the SWO into something that’s much more useful and easily digested. That’s where orbstat comes in.
The GNU compiler is mature and well tested, and over the years various smart people have bolted bits and pieces onto it to make their own lives easier…the trouble is it’s not always very easy to figure out exactly how to use that stuff in your own code, and the instrumentation functionality is a pretty good example of that.
Figuring out where your program is spending its time, what is calling what and just how often is difficult enough on a desktop platform, never mind about on an embedded one without the convenience of a screen, keyboard and copious storage. No matter, we can use the functions those smart people already developed, together with the SWO to offload the resulting data, to deliver powerful visualization from even the most inscrutable red led flasher.
To do this we will be using the __cyg_profile_func_enter and __cyg_profile_func_exit capabilities. The prototypes look something like this;
void __cyg_profile_func_enter (void *func, void *caller);
void __cyg_profile_func_exit (void *func, void *caller);
As you might guess from their names, it’s possible to convince gcc to insert calls to these two functions at the entry and exit of any function. Doing that just needs a single additional incantation on your gcc command line -finstrument_functions.
…and thats it! Any code compiled with this option will automatically call the entry and exit routines as it runs. OK, so it’ll be slower than it would be on a normal day, but you’re not running your CPU at 100% load anyway are you? are you?
There’s a one gotcya though. Instrument-functions will instrument every function…including the entry and exit ones, resulting in a vicious circle and a visit to the Hardfault_Handler in short order. Fortunately, the smart folks thought that one through too, and you can label individual functions to not be instrumented with the __attribute__ ((no_instrument_function)) decorator. There are probably entire files you don’t want instrumenting too, and they even covered that with an exclude file list that accepts partial matches. I’m not really interested in profiling my OS or the CMSIS, so my exclude list looks like;
-finstrument-functions-exclude-file-list=CMSIS,FreeRTOSSo, we’ve got a mechanism for figuring out when we enter and leave routines. We just need to do is offload that from the CPU to somewhere we can post-process it. That’s a job for the SWO. Here’s a simple implementation that will report function entries and exits over ITM Channel 1;
__attribute__ ((no_instrument_function))
              void __cyg_profile_func_enter (void *this_fn, void *call_site)
{
    if (!(ITM->TER&(1<<TRACE_CHANNEL))) return;
    uint32_t oldIntStat=__get_PRIMASK();

    // This is not atomic, but by using the stack for
    //storing oldIntStat it doesn't matter
    __disable_irq();
    while (ITM->PORT[TRACE_CHANNEL].u32 == 0);

    // This is CYCCNT - number of cycles of the CPU clock
    ITM->PORT[TRACE_CHANNEL].u32 = ((*((uint32_t *)0xE0001004))&0x03FFFFFF)|0x40000000;
    while (ITM->PORT[TRACE_CHANNEL].u32 == 0);
    ITM->PORT[TRACE_CHANNEL].u32 = (uint32_t)(call_site)&0xFFFFFFFE;
    while (ITM->PORT[TRACE_CHANNEL].u32 == 0);

    ITM->PORT[TRACE_CHANNEL].u32 = (uint32_t)this_fn&0xFFFFFFFE;
    for (uint32_t d=0; d<DELAY_TIME; d++) asm volatile ("NOP");

    __set_PRIMASK(oldIntStat);
}

__attribute__ ((no_instrument_function))
              void __cyg_profile_func_exit (void *this_fn, void *call_site)
{
    if (!(ITM->TER&(1<<TRACE_CHANNEL))) return;
    uint32_t oldIntStat=__get_PRIMASK();
    __disable_irq();
    while (ITM->PORT[TRACE_CHANNEL].u32 == 0);
    ITM->PORT[TRACE_CHANNEL].u32 = ((*((uint32_t *)0xE0001004))&0x03FFFFFF)|0x50000000;
    while (ITM->PORT[TRACE_CHANNEL].u32 == 0);
    ITM->PORT[TRACE_CHANNEL].u32 = (uint32_t)(call_site)&0xFFFFFFFE;
    while (ITM->PORT[TRACE_CHANNEL].u32 == 0);
    ITM->PORT[TRACE_CHANNEL].u32 = (uint32_t)this_fn&0xFFFFFFFE;
    for (uint32_t d=0; d<DELAY_TIME; d++) asm volatile ("NOP");
    __set_PRIMASK(oldIntStat);
}
You’ll recall from our previous discussions that each of the ITM channels runs independently, so you can have this code running while still throwing this visualization out of the port. There’s also a bit of slowdown code in there just in case the link gets flooded but, in reality, it’s not been a big deal as long as you don’t try to use the link heavily for anything else at the same time (the channel pretty much rate-limits itself due to the busy-spins in the code above … the slower your SWO, the slower your CPU).
The CPU needs to be configured to pass the SWO along. Assuming you’re using orbuculum with the orbtrace.init macros then that bit is easy enough with the following in your .gdbinit (this example is using the Bluepill variant of the Blackmagic probe…its an exercise for the reader to use a different probe);
source ../../orbuculum/Support/gdbtrace.init
target extended-remote /dev/ttyACM0
monitor swdp_scan
file ofiles/firmware.elf
attach 1
set mem inaccessible-by-default off
set print pretty load start
# ======================================
# Change these lines for a different CPU or probe
enableSTM32F1SWD
monitor traceswo 2250000
prepareSWD 72000000 2250000 0 0
# ======================================
dwtSyncTAP 3
dwtCycEna 1
ITMId 1
ITMGTSFreq 3
ITMTSPrescale 3
ITMTXEna 1
ITMSYNCEna 1
ITMEna 1
ITMTER 0 0xFFFFFFFF
ITMTPR 0xFFFFFFFF
So, we’ve got the stuff into the PC…how do we handle it? If you just want to see it’s there you can use orbcat, with a command like;
>orbcat -c 1,"0x%08x\n"
0x414aa2e0
0x08000efe
0x0800770c
0x514aa46c
0x08000efe
0x0800770c
0x414ab5b6
0x08001f42
0x080076ac
0x514ac871
0x08001f42
0x080076ac
0x414b0212
0xfffffffc
0x08006200
0x414b03cd
0x08006400
…Great, but not exactly useful. What we really need is something that takes these data, maps them across to the elf file containing the firmware that’s running on the CPU and turns the whole thing back into sensible data.
Fortunately, orbstat does that for you. The magic command you’re looking for is;
>orbstat -e firmware.elf -y xx.dotThis will swallow that output, cross reference it with the debug information in your elf file, and write the whole resulting mess out to a GraphViz input file. All that’s needed then is to ask graphviz nicely to turn it into a perty picture;
>dot xx.dot -o -Tpdf > o.pdf…and here’s the result for a trivially simple app (Click for a bigger image). Suddenly I can see exactly what is calling what, and how often, per second;
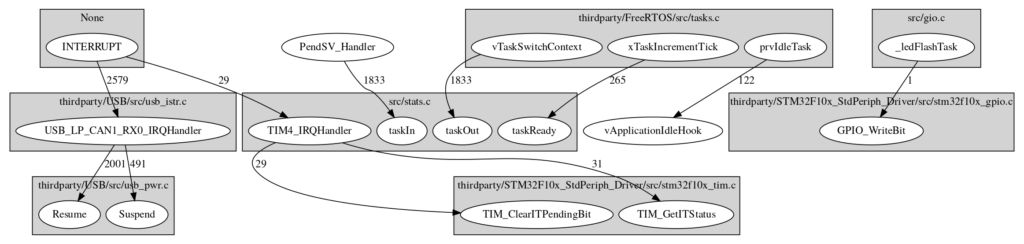
This is only the start. Pretty pictures are one thing, and a useful one at that, but being able to fly around that picture and dive in and out of elements of it is something quite a lot better. That’s the next installment.