The nice thing about standard file formats, is that they’re standard file formats, which means you can use other tools with them…even ones you hadn’t really designed for in the first place.
José Fonseca’s gprof2dot is a great example of exactly that. It takes a variety of file formats and twists and mangles them into nicer graphs than the orbuculum tools do natively. You’ll need Python and GraphViz installed, then just create your source file exactly the same as if you were using KCacheGrind;
>ofiles/orbstat -e firmware.elf -z test.out…but then, rather than starting KCachegrind on the resulting output, stick it into gprof2dot instead. The file is in callgrind format, so the incantation is straightforward;
>gprof2dot -f callgrind test.out > a.dot…and finally, the dot magic;
>dot a.dot -o -Tpdf > o.pdfand you’ll get a rather nice graph showing you exactly where your code spent its time, with the hot paths highlighted;
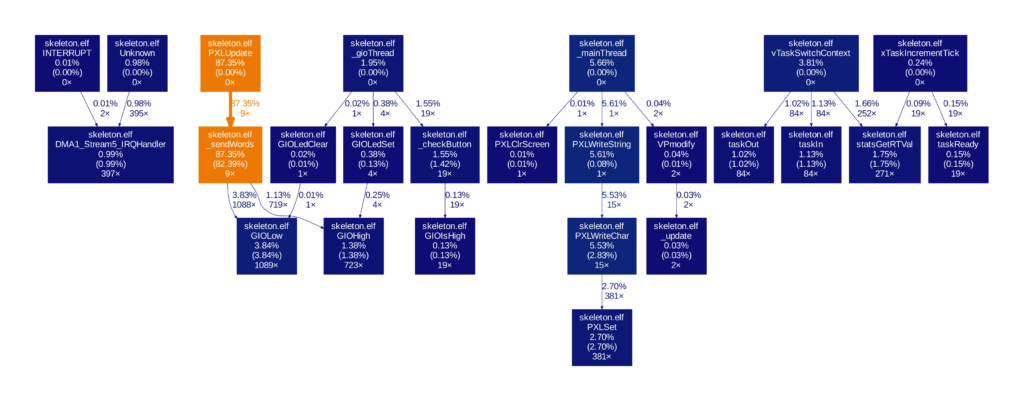
You’ll find plenty of options for changing the format and layout on José’s github page, and plenty more tools for grokking callgrind format files floating around on the web.