SWO is the underloved younger brother of SemiHosting. Only available on M3 and above, it provides a flexible window into the behaviour of your target. In the simplest use case, it’s a high speed output only debug serial port.
SWO is a very powerful, and underused, debugging capability. Understanding it requires a bit of background about the various bits of the ARM CoreSight Debug architecture that participate in it. CORTEX-M doesn’t implement full-on CoreSight, its more a sort of lightweight version of it and there are only three component subsystems that have a role, at least, for the kinds of cores we’re talking about today;
- Embedded Trace Macrocell (ETM): Provides live tracing of what the CPU is actually doing
- Instrumentation Trace Macrocell (ITM): Provides multi-channel program-controlled data output
- Data Watchpoint & Trace (DWT): Provides watchpoints and change-tracking output
ARM have a bit of a habit of talking in TLAs (Thee Letter Acronyms) that make this stuff more impenetrable than it needs to be, but once you’re in the club you can use the TLAs too to keep the riff-raff out, so try and keep up.
Now, each of these three data sources are configured either programmatically or via the debug port. Their output flows through to the Trace Port Interface Unit (TPIU…I guess they ran out of combinations of only three letters) and that talks to the outside world. The block diagram of the TPIU looks like the diagram below;
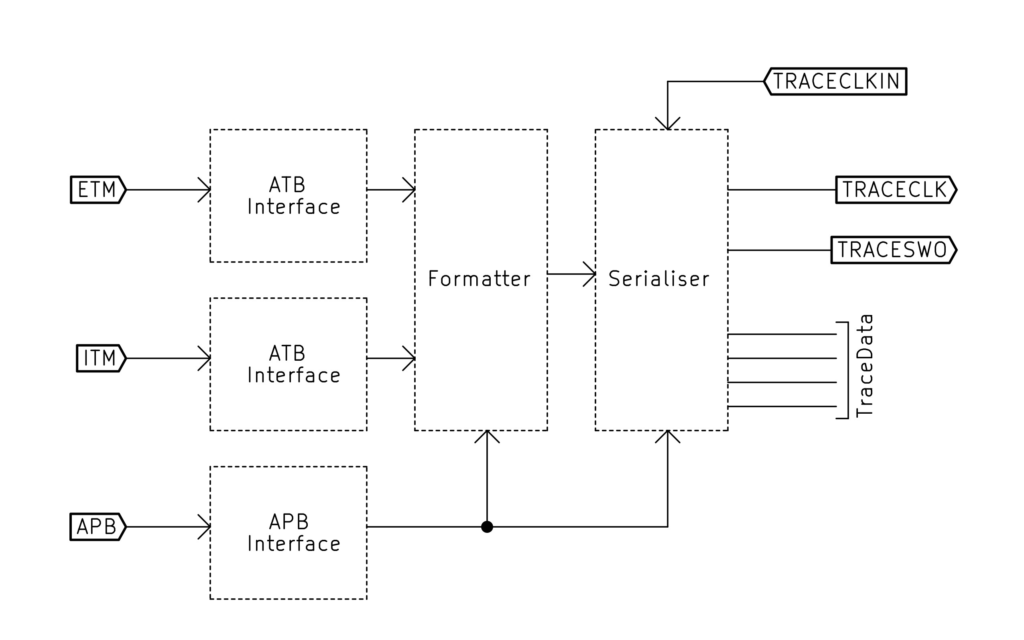
The TPIU consists of a number of functional blocks; Interfaces to the ETM, ITM and APB (ARM Peripheral Bus, for config and management), a formatter to frame up the data from these sources and a serialiser to turn it into an appropriate format to be sent over the wire. DWT is the poor stepchild here. It sends its data via the ITM and never seems to get mentioned in letters home…but when we talk about ITM, you can assume the DWT is along for the ride too.
The formatter multiplexes the available data sources into packets that are sixteen bytes long. The formatting of this multiplexed packet is really rather clever (see Section D4 in here) and is designed to minimise the overhead that the multiplexing imposes. When you’re only using the TPIU for ITM output (See, you’re getting the hang of these TLAs) the formatter can be bypassed and the ITM data are passed directly to the Serialiser, thus reducing overhead and simplifying the packet format. That is indeed the way the SWO is often used in ‘simple’ implementations.
The serialiser is interesting. You’ll notice it has both a TRACESWO output and a four bit TraceData output too.
The four bit TraceData, in conjunction with the TRACECLK output, is used for ‘parallel trace’. It has higher bandwidth than the single wire output (which allows it to do new things) but, importantly, it’s fed from the same data sources so, modulo bandwidth limitations, you can do the same things with the TRACESWO output that you can do with the TRACEDATA outputs. To deal with TRACEDATA you’ll need an ORBTrace or similar hardware, but for now TRACESWO is the star of the show.
The serialiser kicks data out of the TRACESWO pin at a rate governed by the TRACECLKIN (which is fed on-chip by some clock source or other). Data can be sent out either Manchester encoded, or in UART format that will be more familiar to many people. You’ll hear the terms NRZ (Non-Return to Zero) and RZ (Return to Zero) used to describe these formats. You can Google for more information easily enough, but the important thing is that a RZ protocol also encodes the clocking information (at the expense of double the bandwidth requirement) whereas a NRZ protocol requires you to know the bitrate ahead of time. If you’re developing custom hardware to swallow the TRACESWO output you’d want to use RZ, if you’re hoping to use a TTL UART, then it’s NRZ all the way. The NRZ TRACESWO output format is hardwired as 8 databits, 1 stop bit, no parity.
So, let’s recap where we are. By the appropriate configuration of registers we can get realtime logging, exception and even execution trace out of our CPU via a single pin. We can even get those data out via a logic level UART connection (and yes, you can just capture the output using one of those horrible USB to UART adaptors). Next step – how do you grok the data on the host side?
Well, if all you want is a extra serial output for debug then that’s easy – configure the TPIU to bypass the formatter and to spit out the messages in NRZ format, then make sure you write to ITM channel 0 and hang a USB to UART adaptor off the SWO pin with a terminal application on the host. You’re done. You’ll even find a suitable call in the CMSIS, ITM_SendChar, which will send a single character over the link on channel 0 to drop out on your host.
The magic incantations to get all of this going fall into two parts; the first is chip specific to configure the SWO pin for use, the second is CORTEX-M generic, to configure the ITM, DWT, ETM and TPIU (although, in reality, you can largely ignore the ETM if you’re just wanting simple debug output, and the DWT just needs to provide sync to the ITM). Something like this suffices for a STM32F103;
/* STM32 specific configuration to enable the TRACESWO IO pin */
RCC->APB2ENR |= RCC_APB2ENR_AFIOEN;
AFIO->MAPR |= (2 << 24); // Disable JTAG to release TRACESWO
DBGMCU->CR |= DBGMCU_CR_TRACE_IOEN; // Enable IO trace pins for Async trace
/* End of STM32 Specific instructions */

*((volatile unsigned *)(0xE0040010)) = 625; // Output bits at 72000000/625+1)=115.2kbps.
*((volatile unsigned *)(0xE00400F0)) = 2; // Use Async mode pin protocol
*((volatile unsigned *)(0xE0040304)) = 0; // Bypass the TPIU formatter and send output directly

/* Configure Trace Port Interface Unit */
CoreDebug->DEMCR |= CoreDebug_DEMCR_TRCENA_Msk; // Enable access to registers
DWT->CTRL = 0x400003FE; // DWT needs to provide sync for ITM
ITM->LAR = 0xC5ACCE55; // Allow access to the Control Register
ITM->TPR = 0x0000000F; // Trace access privilege from user level code, please
ITM->TCR = 0x0001000D;
ITM->;TER = 1; // Only Enable stimulus port 1

while (1)
{
    for (uint32_t i=’A’; i<=’Z’; i++)
    ITM_SendChar(i);
}
So, there you go, serial port debug with low overhead and without it actually costing you a serial port on the target. The good stuff, however, using the real capabilities of the ITM and DWT, you only get if you spend more effort understanding those two macrocells, and if you put real decode software on the host side. That’s where Orbuculum comes in. Here’s a short YouTube Video from ARM giving a better overview of this stuff than I ever could.