ORBTrace offers a heck of a lot of functionality. This article doesn’t cover more than a small fraction of it, but it should serve as a get-you-going out of the box walk-through to get simple debugging up using gdb and openocd in conjunction with ORBTrace.
It easily gets confusing which bits do what, so here’s a quick overview; ORBTrace provides the interface to your target and exports a CMSIS-DAP connection which OpenOCD connects to. That exports a gdb remote interface that gdb connects to…and it’s gdb that you use to debug your program. Now we’ve got that cleared up, let’s move on….
Opening the box
In the box you should find the ORBTrace probe, a 10-pin 0.05″ connecting lead and a 20-pin 0.05″ connecting lead. You’ll sometimes hear these described as 9-pin and 19-pin leads because pin 7 isn’t used, but they’re they same thing. If you’ve got a case kit with your ORBTrace then you’ll want to assemble that before going much further, but that’s outside the scope of this article.
You’ll need a lead from your host (USB-A or USB-C) to the ORBTrace probe (USB-C) connecting lead to connect from the host PC to the ORBTrace device. That isn’t in the box, but is in a drawer somewhere in your house. Your mission is to figure out which drawer.
Powering Up
OK, having found the USB lead, plug ORBTrace into your PC. The Status led will go Red-Yellow-Red-Green. The ‘production’ firmware is now running and you should be able to see the device in your usb tree;
>lsusb
Bus 001 Device 031: ID 1209:3443 Generic Orbtrace
>lsusb -d 1209:3443 -v | grep 'iSerial'
  iSerial                 3 36FC6192A2189006
Don’t worry about any Resource temporarily unavailable warnings at this point…they just mean lsusb can’t get at some of the more privileged information.
Simple Testing
Assuming you’ve installed the Orbuculum suite you can use the orbtrace applet to control the probe and make sure it’s running. We’ll use it to switch the probe power supplies on and off to show that everything is working OK. Without either of the debug cables attached try;
>orbtrace -p vtpwr,3.3 -e vtpwr,onYou should see the VTPwr led turn blue. You can set the voltage level to 5V with -p vtpwr,5.0 and then the VTPwr led will go purple. To turn it off;
>ofiles/orbtrace -e vtpwr,off
…and the led will go off. VTPwr is power applied to pins 11 & 13 of the 20-pin header, so it’s only available on your target if you’re using that header. Its restricted to 5V and 3.3V by gateware. It is also possible to ‘push’ power into the Reference pin (pin 1) of the 10-pin header. That’s useful for powering up a target directly but it should be used with caution as it’s not really in the spirit of the specification. It’s restricted to 1.8V and 3.3V by gateware. Set 3.3V like this;
>orbtrace -p vtref,3.3 -e vtref,on
..and now VTRef should light up blue. There is nothing intrinsically stopping you from providing power via both VTRef and VTPwr, so think about what you’re doing! In general you will only need power via one of them, but VTRef must always be getting power from somewhere otherwise the line drivers won’t work and you will not be able to communicate with your target!
Lets Connect
In the Orbmule repository you will find the Simple demo. This is the basic application we will use for testing. It has been developed using the STM32F427VI muleboard, but it’s deliberately written to be as generic as possible and it doesn’t use anything that is CPU specific (indeed, even the startup and linker files are the generic ones you’ll find in the gdb distribution). For the worst case, to target for other M4 processors you should only need to change the memory configuration in system/linker.ld, and possibly some paths at the head of the Makefile depending on where you’ve got your compiler suite installed. Incidentally, if you’ve not got a compiler suite, head over to Arm to fix that problem sharpish.
Let’s start by building the application;
 >make
 Compiling src/main.c
 Compiling src/itm_messages.c
 Assembling system/startup_ARMCM4.S
   text       data     bss     dec     hex filename
   1500       1080   10068   12648    3168 ofiles/simple.elf
>
Your exact numbers may vary depending on compiler versions, but the important thing is that you’ve now got an output file in ofiles/simple.elf. You’ll also have mapfiles and other things in there too, but hopefully you won’t be needing those. We’ll use openocd to handle the connection for us, so let’s create a minimal .gdbinit to support it and load the application using an openocd I created earler (which you might need to change if you’re using a different chip);
!killall openocd
!orbtrace -p vtpwr,3.3 -e vtpwr,on
!openocd -f /opt/orb/orbtrace/support/muleboard.ocd &
file ofiles/simple.elf
target extended-remote localhost:3333
set mem inaccessible-by-default off
load
Basically, this powers up your target using the VTPwr pins at 3.3V, kills any old openocd instances that are laying around and starts a new one. It then selects our application file, connects to the openocd instance that it just started, loads the application into it and then resets the chip ready to start.
Connect your target to ORBTrace using either the 10-pin or 20-pin header (it doesn’t matter which for this example, we’re only using theSWD, SWCLK and Gnd pins anyway…but be careful to use VTRef if you’re on the 10-pin connector as VTPwr isn’t carried over that), run arm-none-eabi-gdb and you should see something like this;
>arm-none-eabi-gdb
GNU gdb (GNU Arm Embedded Toolchain 9-2020-q2-update) 8.3.1.20191211-git
Copyright (C) 2019 Free Software Foundation, Inc.
License GPLv3+: GNU GPL version 3 or later <http://gnu.org/licenses/gpl.html>
This is free software: you are free to change and redistribute it.
There is NO WARRANTY, to the extent permitted by law.
Type "show copying" and "show warranty" for details.
This GDB was configured as "--host=x86_64-linux-gnu --target=arm-none-eabi".
Type "show configuration" for configuration details.
For bug reporting instructions, please see:
<http://www.gnu.org/software/gdb/bugs/>.
Find the GDB manual and other documentation resources online at:
<http://www.gnu.org/software/gdb/documentation/>.
For help, type "help".
Type "apropos word" to search for commands related to "word".
openocd: no process found
Open On-Chip Debugger 0.11.0+dev-00464-g5a0b4889d-dirty (2021-11-15-23:45)
Licensed under GNU GPL v2
For bug reports, read
http://openocd.org/doc/doxygen/bugs.html
Info : Listening on port 6666 for tcl connections
Info : Listening on port 4444 for telnet connections
Info : Using CMSIS-DAPv2 interface with VID:PID=0x1209:0x3443, serial=36FC6192A2189006
Info : CMSIS-DAP: SWD supported
Info : CMSIS-DAP: JTAG supported
Info : CMSIS-DAP: FW Version = 2.1.0
Info : CMSIS-DAP: Interface Initialised (SWD)
Info : SWCLK/TCK = 1 SWDIO/TMS = 1 TDI = 1 TDO = 1 nTRST = 1 nRESET = 0
Info : Connecting under reset
Info : CMSIS-DAP: Interface ready
Info : clock speed 5000 kHz
Info : SWD DPIDR 0x2ba01477
Info : stm32f4x.cpu: Cortex-M4 r0p1 processor detected
Info : stm32f4x.cpu: target has 6 breakpoints, 4 watchpoints
Info : starting gdb server for stm32f4x.cpu on 3333
Info : Listening on port 3333 for gdb connections
Info : accepting 'gdb' connection on tcp/3333
Info : SWD DPIDR 0x2ba01477
target halted due to debug-request, current mode: Thread
xPSR: 0x81000000 pc: 0x08000130 msp: 0x2001fff4
Info : device id = 0x20036419
Info : flash size = 2048 kbytes
Info : Dual Bank 2048 kiB STM32F42x/43x/469/479 found
Info : flash size = 512 bytes
target halted due to debug-request, current mode: Thread
xPSR: 0x01000000 pc: 0x08000298 msp: 0x20020000
Loading section .text, size 0x5d4 lma 0x8000000
Loading section .ARM.exidx, size 0x8 lma 0x80005d4
Loading section .data, size 0x438 lma 0x80005dc
Start address 0x8000298, load size 2580
Transfer rate: 4 KB/sec, 860 bytes/write.
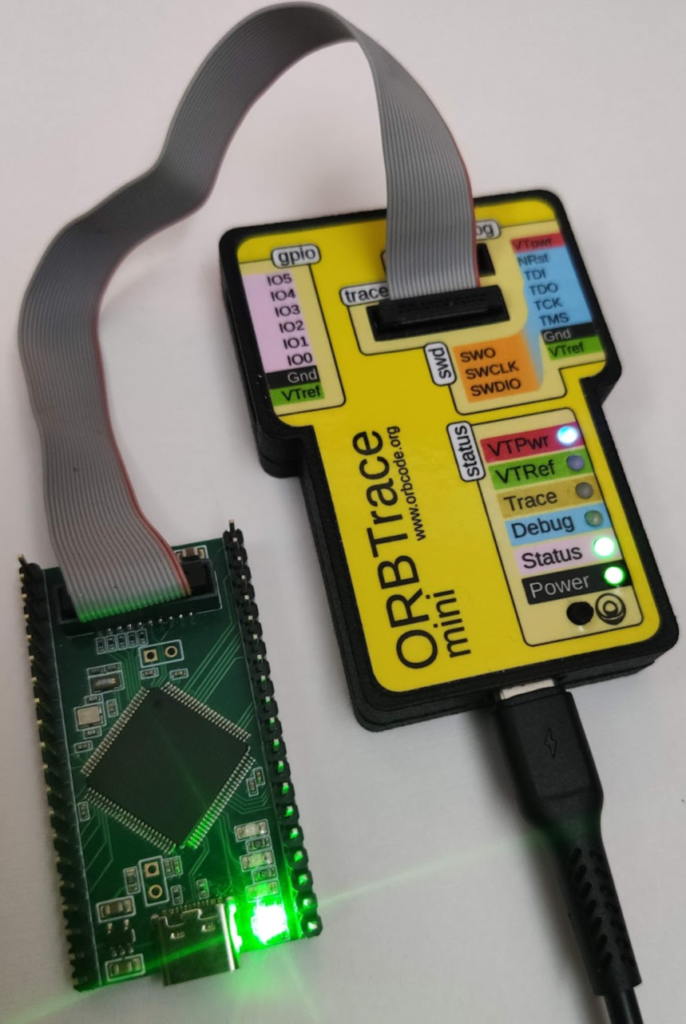
(gdb) and the LEDs should all magically spring to life, like this;
Note that because you started openocd and gdb in the same terminal then you’ll get the output blended. That’s not normally a problem because openocd is pretty silent when its running. If you want it to run in a separate window and still terminate when gdb does then replace the line !openocd -f /opt/orb/orbtrace/support/muleboard.ocd & with something like;
!gnome-terminal --hide-menubar --title "OpenOCD Session" --zoom 0.8 -- openocd -f /opt/orb/orbtrace/support/muleboard.ocd…and that’s it. You’ve loaded your application and you’re good to go. Follow a decent GDB Tutorial to learn more about one of the most powerful debuggers out there.