SWOs credibility as a debug solution comes from it’s ability to support multiple software output channels, but it’s real capability is only realised when you use the hardware monitoring functions it offers too.
In my previous post I alluded to the hardware capabilities that the SWO ITM macrocell offered by virtue of the Data Watchpoint & Trace (DWT) macrocell. In this post we’re going to scratch the surface of what you can do with that.
DWT messages are encoded in exactly the same way as software ones, but they are generated automatically by hardware rather than programmatically. You’ll recall that event counters, exceptions, PC value and data traces can all be output by the DWT, so in this post we’ll provide a couple of examples of how to use that functionality.
If you’ve got orbfifo running, you’ll notice one extra fifo in its output directory alongside whatever you have defined. That is called hwevent and is a simple continuous dump of whatever DWT events you’ve got switched on. By default, with the standard gdb orbuculum startup script, no events are requested for reporting, and so that fifo remains empty. From the gdb command line (assuming you’ve included the line source ../orbuculum/Support/gdbtrace.init in your .gdbinit file) you can find out quite a lot about the possibilities for configuring the ITM & DWT;
(gdb) help orbuculum
GDB SWO Trace Configuration Helpers
===================================

Setup Device
------------
STM32;
  enableSTM32SWO  : Enable SWO on STM32 pins (for STM32F4 if 4 is passed as first argument)
  enableSTM32TRACE: Start TRACE on STM32 pins

IMXRT;
  enableIMXRT102XSWO : Enable SWO on IMXRT102X series pins (AD_B0_04)
  enableIMXRT106XSWO : Enable SWO on IMXRT106X series pins (AD_B0_10)

SAM5X;
  enableSAMD5XSWD    : Enable SWO on SAM5X output pin on SAM5X

NRF;
  enableNRF52TRACE : Start TRACE on NRF52 (not nrf52833 or nrf52840) pins
  enableNRF53TRACE : Start TRACE on NRF53* pins

EFR32MG12;
  enableEFR32MG12SWO : Start SWO on EFR32MG12 pins

All;
  prepareSWO      : Prepare SWO output in specified format
  startETM        : Start ETM output on channel 2

Configure DWT
-------------
dwtPOSTCNT        : Enable POSTCNT underflow event counter packet generation
dwtFOLDEVT        : Enable folded-instruction counter overflow event packet generation
dwtLSUEVT         : Enable LSU counter overflow event packet generation
dwtSLEEPEVT       : Enable Sleep counter overflow event packet generation
dwtDEVEVT         : Enable Exception counter overflow event packet generation
dwtCPIEVT         : Enable CPI counter overflow event packet generation
dwtTraceException : Enable Exception Trace Event packet generation
dwtSamplePC       : Enable PC sample using POSTCNT interval
dwtSyncTap        : Set how often Sync packets are sent out (None, CYCCNT[24], CYCCNT[26] or CYCCNT[28])
dwtPostTap        : Sets the POSTCNT tap (CYCCNT[6] or CYCCNT[10])
dwtPostInit       : Sets the initial value for the POSTCNT counter
dwtPostReset      : Sets the reload value for the POSTCNT counter
dwtCycEna         : Enable or disable CYCCNT

Configure ITM
-------------
ITMId             : Set the ITM ID for this device
ITMGTSFreq        : Set Global Timestamp frequency
ITMTSPrescale     : Set Timestamp Prescale
ITMSWOEna         : TS counter uses Processor Clock, or clock from TPIU Interface
ITMTXEna          : Control if DWT packets are forwarded to the ITM
ITMSYNCEna        : Control if sync packets are transmitted
ITMTSEna          : Enable local timestamp generation
ITMEna            : Master Enable for ITM
ITMTER            : Set Trace Enable Register bitmap for 32*<Block>
ITMTPR            : Enable block 8*bit access from unprivledged code

Configure ETM
-------------
describeETM       : Provide information about the ETM implementation on this target

(gdb)
There is another layer of help information below this top layer (beware that gdb doesn’t like MixedCase when you’re trying to do tab completion);
(gdb) help dwtTraceException
dwtTraceException <0|1> Enable Exception Trace Event packet generation
(gdb)
Understanding some of these options does need a bit of perusal of the DWT and ITM technical documentation I’m afraid, but I’ll get around to writing something up on some of the more useful of them eventually (or, if someone else fancies making a textual contribution, it would be gratefully received….)
OK, so let’s give that a go, and see what we get in the hwevent fifo now;
(gdb) dwtTraceException 1

>cat hwevent
1,2,Resume,Thread
1,989,Enter,SysTick
1,6,Exit,SysTick
1,1,Resume,Thread
1,989,Enter,SysTick
1,4,Exit,SysTick
1,1,Resume,Thread
1,996,Enter,SysTick
1,5,Exit,SysTick
1,2,Resume,Thread
1,996,Enter,SysTick
1,6,Exit,SysTick
1,2,Resume,Thread
1,985,Enter,SysTick
...etc
The ‘1’ in the first column is the event type (an Exception Trace Event), followed by the time in uS since the previous event. That is followed by the condition, and by the Exception itself. This particular trace is for an otherwise idle FreeRTOS application with a 1mS system tick timer. You can see that the CPU entered the thread state and 989uS later dealt with a SysTick event that took 6uS to handle, and that that process continued during the sample time…that’s quite a level of insight for no code changes at all!
There are 993uS to 1003uS between SysTicks in this sample, and that brings us to one of the big problems with this technique. To save bandwidth across the link the timestamps are generated on the host rather than the target, so they are inevitably inaccurate and, even with this compromise, the TRACESWO quickly becomes overload. You will see ITM Overflow warning messages from orbuculum itself in any realistic application using Exception Tracing…the effective use of Exception Tracing requires parallel trace, so you’ll need to invest in an ORBTrace. By the way, there is a great description about CORTEX-M exceptions available here.
So, instead, let’s move on to something that does work reasonably OK even within the constraints of TRACESWO. Interrupt the application and type;
(gdb) dwtTraceException 0
(gdb) dwtSamplePC 1
(gdb)
…and again we can look at the hwevent fifo;
>cat hwevent

2,1,**SLEEP**
2,2,**SLEEP**
2,1,**SLEEP**
2,2,0x08002f70
2,2,**SLEEP**
2,1,**SLEEP**
2,1,**SLEEP**
...etc
Basically, we can set an interval at which we want the DWT to sample the current value of the Program Counter (by means of the dwtPostTap and dwtPostReset options) and it will tell us the value of PC at that interval. If the target is sleeping then obviously the PC has no value and rather the special value **SLEEP** is returned.
Using combinations of these options you provide information to homebrewed applications that parse the hwevent fifo to infer things about the behavior of your target, but there are alternative ways of getting information which can be easier to use.
In a previous note I mentioned that orbuculum exports a TCP/IP interface on port 3443…we can hook applications to this port and parse the data that are returned. The easiest example (which is completely useless) is;
>telnet localhost 3443
(Oh, CTRL-] followed by q will get you out of that).
Fortunately, the orbuculum gnomes have provided slightly more useful applications than that. The first of these is orbtop, which takes the PC samples, looks them up in the matching firmware elf file (assuming you compiled it with debug info in there) and marshals them into something distinctly useful;
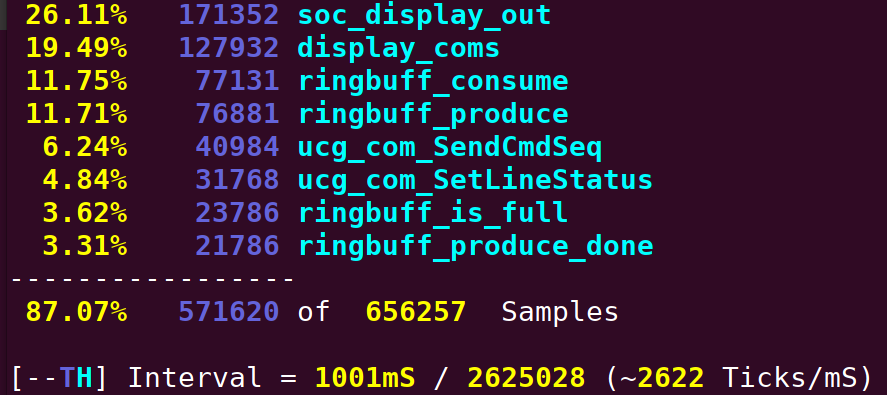
I think that’s enough for now. I doubt you were expecting a full top implementation for your target, with no target software instrumentation needed, but we’re still nowhere near the limits of what we can do.
Till next time….