Sometimes you’d really like to be able to use full trace, but you just don’t have the parallel pins configured on your target, which conventional wisdom tells you you’ll need. You might not be quite out of luck.
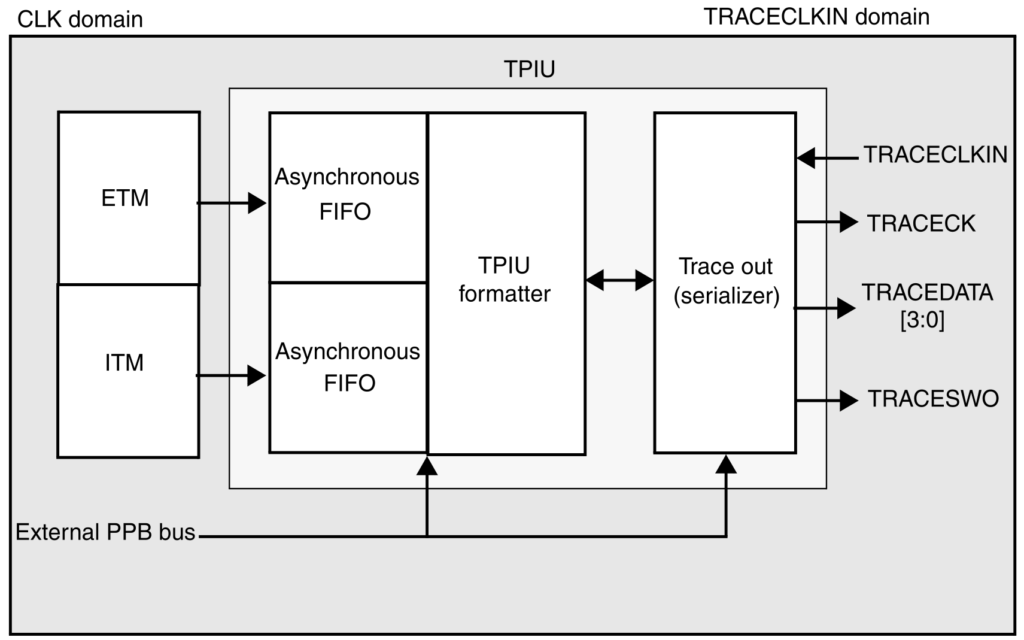
First of all, let’s untangle the word salad. ARM processors deliver instruction trace (a record of every instruction executed, in order) via the Embedded Trace Macrocell (ETM). There are other ways of doing it, but we won’t worry about those here. Normally, the ETM flow is combined with other flows from the CPU (most notably from the Instrumentation Trace Macrocell, or ITM) via the Trace Port Interface Unit (TPIU) which combines them all to be sent out over the trace interface to be delivered to the host for decoding and analysis. With `full coresight` the ETM flow is passed directly to the TPIU that only outputs via the parallel trace pins. This means that when you’re using SWO you don’t get access to the ETM. Generally, chips that implement the full coresight module can’t do instruction trace unless you’ve got the parallel pins available (and a suitable probe to pick up the data). This architecture is documented in Section 11.1 of ARM DDI 0314H.
Fortunately, a few manufacturers have implemented work-arounds for this restriction, so it’s worth checking the reference manual carefully for your specific chip. As one example, ST have implemented what they refer to as a ‘Simple TPIU’ which is capable of passing the ETM through to the SWO pin;
If your chip has this configuration, then ETM can be captured by any device connected to the SWO pin – you don’t need to have the parallel pins connected. Other manufacturers also have different configurations that allow access to the ETM over SWO, perhaps by switching ITM out in favour of ETM, for example.
The SWO pin is obviously pretty bandwidth limited and any losses in the ETM flow make it impossible to reconstruct program execution, but all is not lost.
Two factors work in our favour; The first is that it is possible to configure the ETM to stall the CPU when the trace output buffer is full. Of course this slows the processor down, but if you’re deterministically ending up in the Hardfault_Handler it doesn’t really matter if it takes you 100ms or 200ms to get there, does it? The second factor is that you need a high speed SWO capture device to make this feasible. A UART running at 115Kbps is just going to be too painful to use. Fortunately, nowadays, faster interfaces are commonplace. FTDI UARTs run up to 12Mbps for example, and you can use a logic analyser to collect data at even faster speeds. All these various devices plug into orbuculum, which can post process the ETM output and turn it into something sensible.
Of course, ORBTrace is set up for exactly these use cases. It is faster than the alternatives and can support UART speeds up to 62Mbaud. It also supports Manchester encoding at up to 96Mbaud (but it needs two symbols per bit, so effectively half that, 48Mbits/sec). These speeds are fast enough to realistically support full trace, albeit with throttling.
You might question why you’d want to use Manchester encoding rather than UART, given that the latter is faster. Well, UART requires 10 bits per character so the effective data rate is 6.2MBytes/sec. Manchester sends data in blocks of 8 bytes with a 2 bit header, meaning that the effective data rate over that bearer is 5.82MBytes/sec…in short, the difference isn’t as significant as the headline suggests. Manchester also has the advantage that the clock is encoded into the signalling (2 symbols per bit), so there’s no comms speed matching to be done…provided you’re within the lock range (125Kbps to 48Mbps) your data will be received – and they’ll continue to be received if your clock changes too, as typically happens when you’re moving in and out of low power modes. In short, Manchester encoding is usually the better option, and ORBTrace supports it better than anything else we’ve found so far.
So, let’s try an example. We’ll be working with the `vidout` demonstration which is part of the orbmule repository along with an ORBTrace probe. You can use other probe types without any real changes needed to this recipe except for the command line options to orbuculum…there are notes in italic below where those changes are needed.
The magic is all in the setup of the debug, which can be done via the .gdbinit file. Firstly, we have to turn on the target and tell it we’re using Manchester encoding. We’d like the probe to strip off the TPIU encoding too so we don’t have to deal with it on the host. The magic incantation is;
orbtrace -p vtref,3.3 -e vtref,on -TMThe capital M is the important bit here. In conjunction with the latest ORBTrace 1.4 gateware that tells the probe to use SWO/Manch and to strip the TPIU framing. If you had `-Tm` here it would still use SWO/Manch but then the host would be responsible for stripping the TPIU framing…that would work for ORBTrace 1.3 and earlier, or if you’re using a different type of target interface. For those cases you’ll also need a ‘-t1,2’ on your orbuculum command line so TPIU framing gets stripped somewhere.
…for this particular example we’ll use pyocd, but you can use BMDA or openocd as you prefer. For any option we need to start it up;
pyocd gdb -t stm32f429xg -f 20000000…or for BMDA;
blackmagicThen connect to the probe driver using either;
target extended-remote localhost:3333for pyocd, or
target extended-remote localhost:2000
monitor swd
attach 1
for BMDA.
Then we need to load the helper scripts, make sure the ETM is not already running, and load the application;
source /usr/local/share/orbcode/gdbtrace.init
stopETM
file firmware.elf
load
Now we can set up the SWO channel – firstly we set up the STM32 specific pins, then set the output baudrate and tell it we want SWO/Manch with TPIU framing (the TPIU framing is essential for the ETM to be delivered to the probe…the lightweight mux will simply throw away the ETM flow if it isn’t);
enableSTM32SWO
prepareSWO 168000000 56000000 1 1
Finally, we can arrange for ETM data to be sent from the target to the probe;
dwtSyncTap 3
dwtCycEna 1
startETM 0 1
You’ll find these steps in one file called .gdbinit-swotrace in the vidout project repository.
Now we need to start orbuculum to receive the data;
orbuculum -m 1000 -a 390000000You will need to change the line above to connect to your specific probe, and probably add the TPIU decode options as described previously, if you’re using something other than ORBTrace 1.4…for ORBTrace 1.3 add the option -t1, for example (or upgrade your gateware).
Finally, tickle orbmortem to capture the ETM flow and post process it.
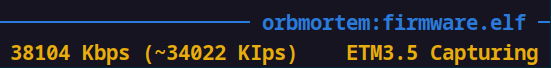
orbmortem -e ofiles/firmware.elfNow, when you start the application (‘c’ in gdb) you’ll see that the status of orbmortem changes from ‘Waiting’ to ‘Capturing’, This means that trace is being delivered from the target over the SWO interface through to the host and on to orbmortem;
In addition, orbuculum tells you that data are being received;
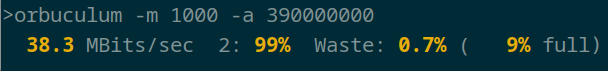
Its worth noting that orbuculum reports the channel as being 9% full. That’s because we specified the bandwidth as being 390Mbaud, the effective capacity of the USB link to the ORBTrace, and only a very small proportion of that is being used. If you’re using a SWO interface such as a FTDI adaptor then you can adjust the ‘-a’ option to suit and your utilisation is likely to be nearer 100%. The value set by -a is only used for the occupancy calculation and has no effect on operation.
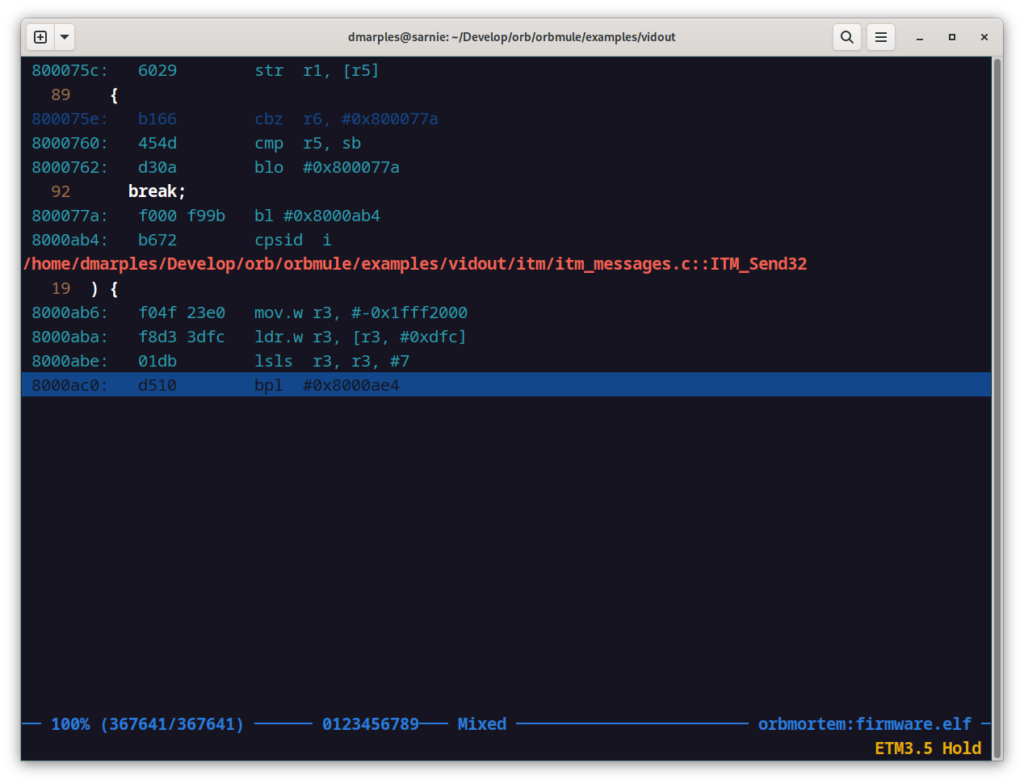
Now, CTRL-C the application and orbmortem will notice that the flow has stopped. It will process the data it currently is holding, ending up with the last instruction to be executed;
So, there you have it, full trace without the need for parallel pins. There are a couple of caveats to all this; You cannot use any ITM software signalling (i.e. debug channels) while performing ETM trace ‘cos the processor just locks up waiting for the SWO to become available, which it’s not going to do, the ETM is hogging it! The biggest constraint though is if your chip is arranged in a way that lets ETM out over the SWO. I’m demonstrating it on a STM32F427 but YMMV.
Finally, with some probe drivers flash erase doesn’t work when you’ve got this ‘stalling trace’ running. I’m guessing that’s because the processor stalls mess with the flash erase timing. BMDA does work correctly so that’s yet another reason for making it your probe driver of choice!
Orbmortem is in development, and I’m sure it doesn’t do everything properly yet, so we’re really keen to hear of any cases where it doesn’t decode your program execution correctly, so we can make sure it’s as slick as possible for everyone.